
How to Build Post Game Analytics Reports
Providing substance for coaches to evaluate gameplay

Introduction
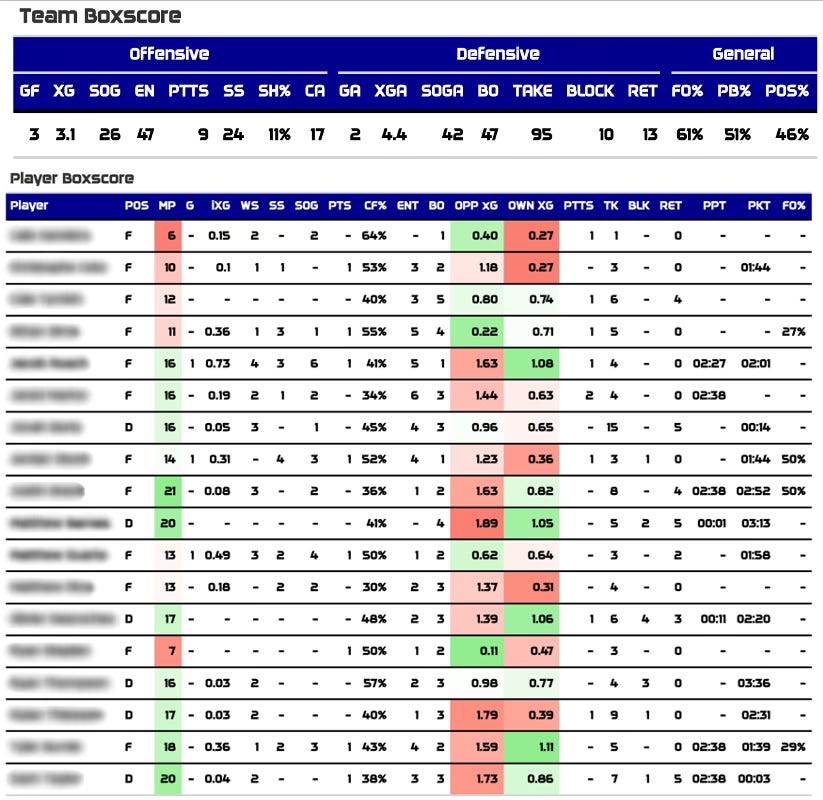
In today’s constantly innovating world of sports technology, being a conduit of information is an extremely valuable role. My goal in generating post-game reports was to provide coaches with a way to get the most important information to their inboxes immediately after the data became available. With that, I wanted to share how I built these reports. While it takes many lines of code, you don’t need to be an expert coder to create them. In the reference image below, you will see the team box score at the top and the player box score below.
Packages
One of my most utilized and favourite packages in R is GT. This package aims to create “a wide variety of useful tables.” You can find an intro to the package here. Along with GT, I also use the packages dplyr, scales, and readr. The dplyrpackage is essential for data manipulation, scales assists in infrastructure changes in ggplot2, and readr is used to work with data in CSV form.
My Process
Based on my experience playing the game and working with coaches, I wanted to ensure one key aspect when building out my report styles: creating something that isn’t fancy but maintains professionalism. Building something digestible and straightforward was my highest priority. Additionally, I made sure to have a master document that explained every visual within my reports. This was essential to avoid any standstill time if the person interpreting the visual had a question about a column name or my process behind the calculation.
Another critical aspect was ensuring that the data presented in the box scores was exactly what the coach wanted. Every coach will have different preferences for which stats matter most to them.
Closing Thoughts
I really enjoy these reports because they look sharp and add substance to the traditional box score. These reports can be easily created for any league and automated. If you want to build these reports, feel free to message me directly, and I will assist in any way I can! If you’re interested in learning R, I highly recommend this guide made by the current analytics coordinator of the New Orleans Pelicans.